Consolidate EHR, billing, and operational data into role-based dashboards to track no-shows, revenue, clinical outcomes, and improve practice efficiency.
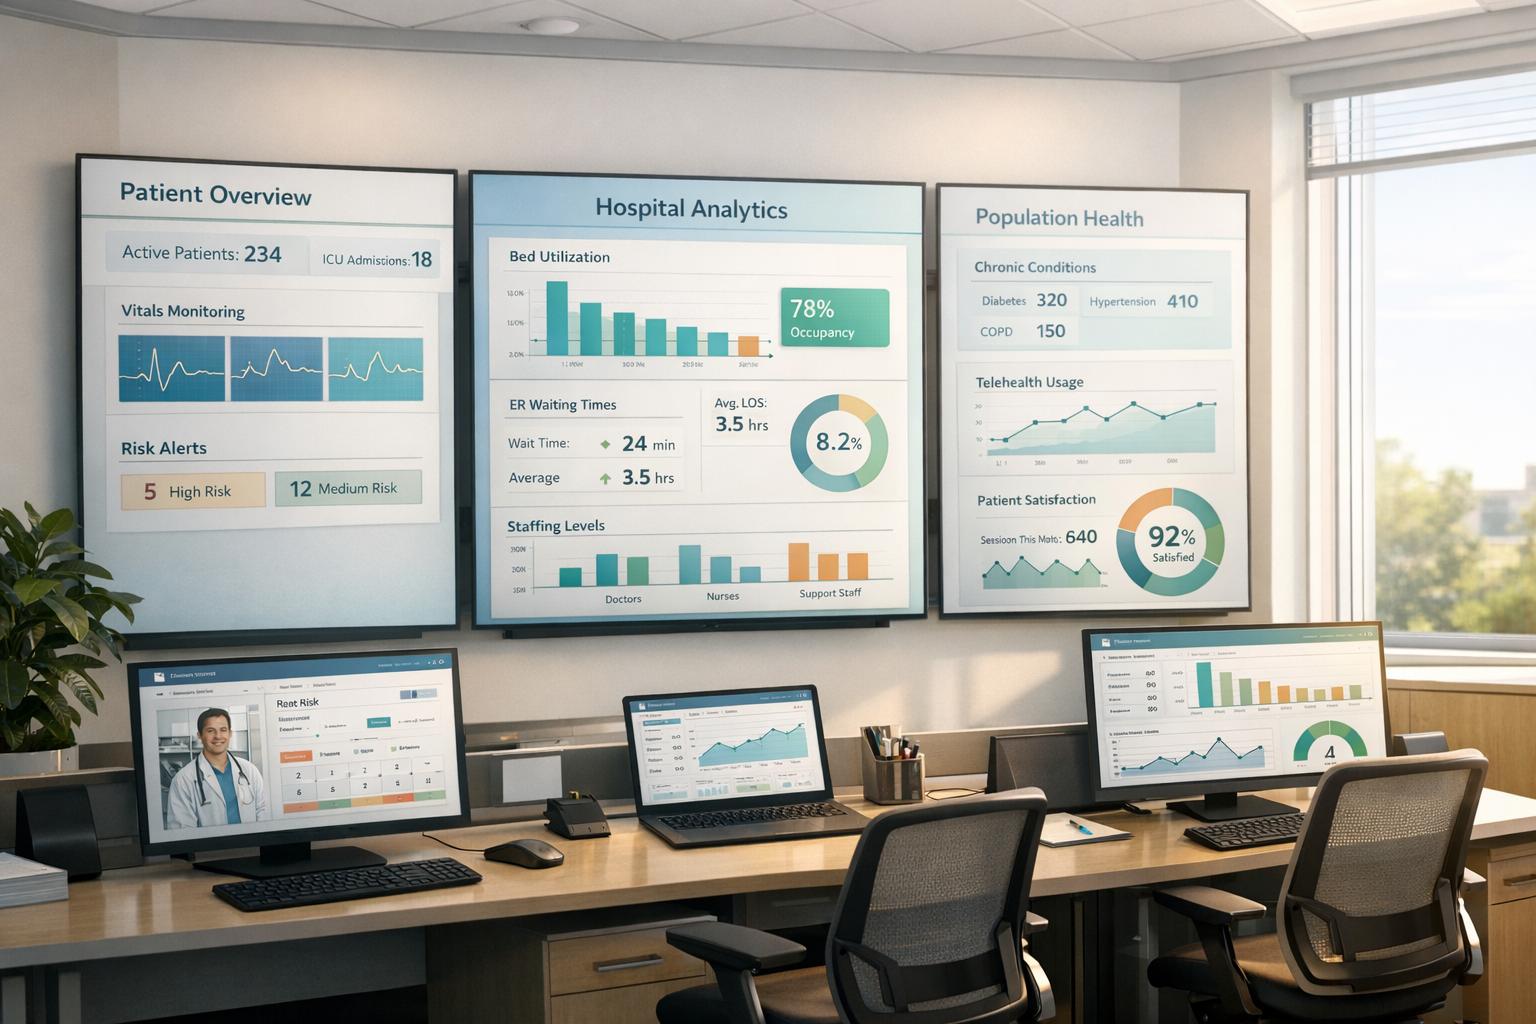
Healthcare analytics dashboards simplify managing your practice by consolidating critical data - like patient schedules, billing, staff performance, and clinical outcomes - into one place. These tools save time, reduce manual reporting, and provide real-time insights for better decision-making. Here's what you need to know:
Dashboards are most effective when integrated with existing systems like EHRs and supported by proper training, automation, and team buy-in. Tools like MedOps enhance functionality by automating tasks like insurance verification, improving workflow efficiency and financial tracking. Start small by focusing on a few key metrics, and build a data-driven culture to streamline operations and improve patient care.
Key Healthcare Dashboard Metrics: Operational, Clinical, Financial, and Patient Experience
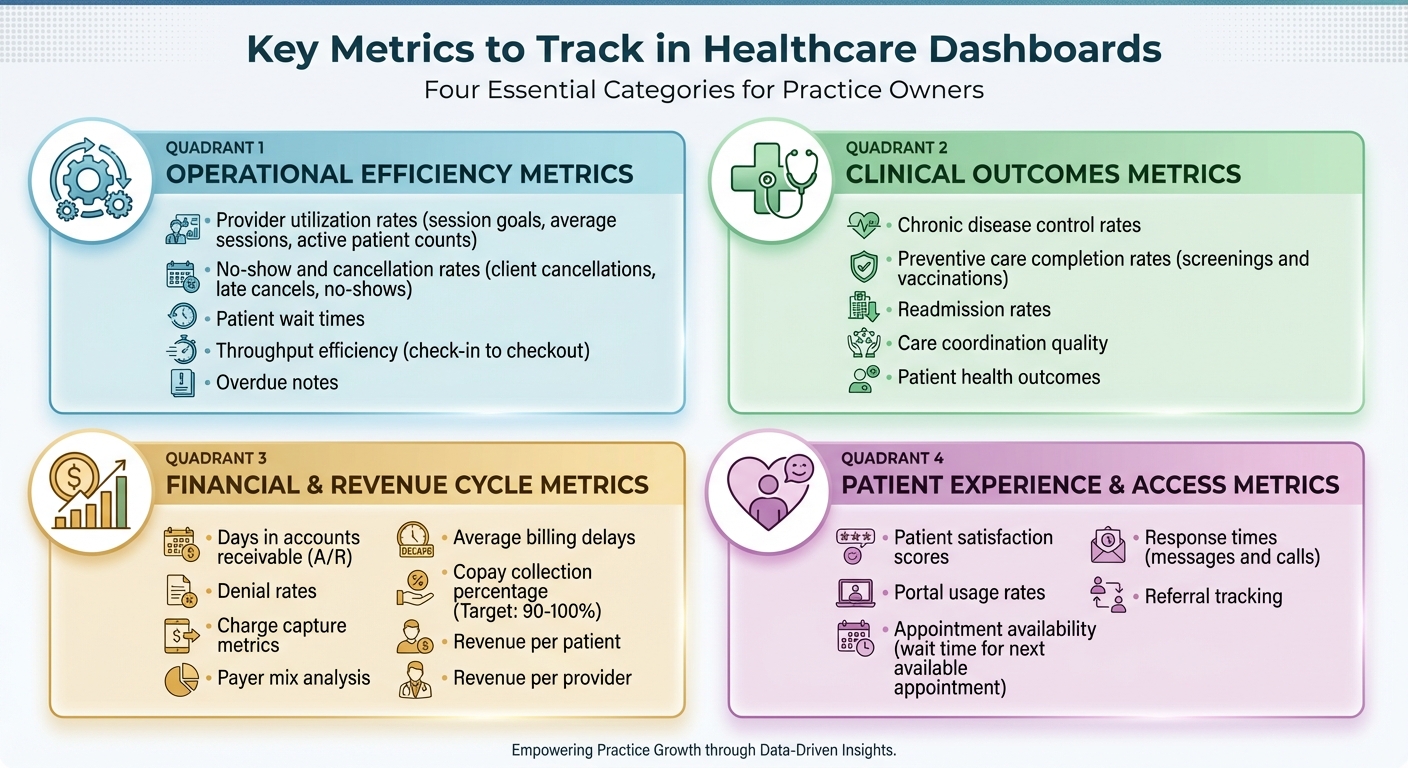
Tracking the right metrics can mean the difference between running a practice reactively or staying ahead of potential issues. By focusing on key data points, you can identify problems early, manage resources wisely, and ensure your practice runs smoothly. Here’s a breakdown of the most important metrics across four key areas.
Operational metrics measure how effectively your practice functions. Provider utilization rates are essential for assessing how well your clinical staff is being used. By keeping tabs on session goals, average sessions, and active patient counts, you can prevent staff burnout and optimize capacity. Keeping an eye on no-show and cancellation rates - including client cancellations, late cancels, and no-shows - helps you refine your booking strategies and minimize wasted appointment slots.
Metrics like patient wait times and throughput efficiency reveal how efficiently patients move through the practice, from check-in to checkout. Long waits can frustrate patients and disrupt your schedule. Additionally, tracking overdue notes ensures compliance and keeps your team accountable.
While operational efficiency is vital, clinical outcomes are equally important for delivering quality care.
Clinical metrics focus on the quality of care provided. For example, chronic disease control rates highlight patients who may need closer monitoring, improving overall health outcomes and meeting quality reporting standards. Preventive care completion rates, such as screenings and vaccinations, show how well you’re helping patients stay healthy.
Another critical metric is readmission rates, which can reveal gaps in care coordination or patient education. High readmission rates not only strain resources but can also harm your practice’s reputation. These insights can guide improvements in workflows and patient support.
Financial health underpins all these efforts, so tracking financial metrics is crucial.
Keeping a close eye on financial metrics ensures your practice remains financially healthy. Start with days in accounts receivable (A/R), which measure how quickly payments are collected - lower numbers mean better cash flow. Denial rates can highlight billing issues that reduce revenue, while charge capture metrics ensure all services provided are billed accurately.
Understanding your payer mix helps you see which insurance providers contribute the most revenue and which ones may be causing challenges. Monitoring average billing delays can uncover inefficiencies in payment processes. Aim for a copay collection percentage of 90–100% to maximize immediate revenue. Lastly, metrics like revenue per patient and revenue per provider allow you to benchmark performance and identify areas needing attention.
Finally, patient experience metrics provide insights into engagement and satisfaction.
Patient satisfaction plays a big role in retention and referrals. Patient satisfaction scores from surveys can show what’s working and where improvements are needed. Portal usage rates measure how often patients use digital tools for scheduling, messaging, or accessing records.
Metrics like appointment availability - such as the average wait time for the next available appointment - directly impact access to care. Long delays can drive patients to seek care elsewhere. Response times for patient messages and calls are equally important, as quick replies build trust and enhance the overall experience. Additionally, referral tracking helps identify which channels are most effective for bringing in new patients.
A dashboard, no matter how powerful, loses its value if users struggle to find or understand the information they need. A well-crafted dashboard should feel intuitive from the start, offering insights at a glance and encouraging quick, informed actions. To achieve this, it's crucial to focus on user needs and design with clarity in mind.
When users aren’t involved in the design process, frustration often follows. Dashboards designed with role-based customization ensure that each user - whether a physician, nurse, administrator, or billing manager - sees only the data relevant to their responsibilities. This approach minimizes information overload and improves productivity.
The best dashboards also allow users to personalize their experience. Features like setting default screens, customizing key performance indicators (KPIs), and adjusting filters should be simple enough for anyone to use - no technical expertise required. Keeping the design clean and streamlined is equally important. Consolidating essential metrics into a single, easy-to-read view can save time and reduce the hassle of navigating multiple screens. Adding action hooks, such as links to detailed records, makes it even easier for users to dive deeper into specific data points.
"Transparency is really important. At the end of the day, every organization is going to have expectations of their therapists, and I think it's important to clearly communicate the data you're monitoring".
By tailoring dashboards to specific roles and needs, and simplifying the interface, users can focus on what matters most. From there, effective visualizations turn raw data into actionable insights.
The way data is presented can make or break its usefulness. Choosing the right visualization type helps transform complex numbers into clear, digestible insights. For example:
Interactive features take dashboards to the next level. Users should be able to filter and explore data by categories like time period, appointment type, provider group, patient demographics, or payer mix. Replacing static spreadsheets with visualizations like these not only highlights patterns but also makes outliers stand out.
A dashboard is only as reliable as the data it’s built on. For accurate reporting, it’s essential to standardize data definitions. For instance, terms like "no-show" versus "late cancel" or metrics like "provider utilization" should have clear, consistent meanings. Regular updates - such as nightly data refreshes - ensure that users are reviewing the most up-to-date information each morning.
Accountability is also key. Assign specific team members to oversee data definitions, manage dashboard content, and resolve discrepancies. Robust security measures, including HIPAA compliance, encryption, and role-based access controls, are non-negotiable when dealing with sensitive patient information.
A real-world example highlights the importance of vigilance: a major referral source temporarily halted patient flow after an EMR update changed report formats, creating confusion. This kind of disruption underscores why continuous monitoring and strong governance are critical.
Dashboards can revolutionize how healthcare practices use data. But for them to truly make a difference, a structured approach is essential. By focusing on planning, technical integration, and change management, you can transform a dashboard from just another tool into a powerful driver of meaningful improvements.
Start by evaluating your current systems and identifying any data silos that need attention. From there, establish a clear vision by defining specific goals and success metrics. Whether you're looking to cut down patient wait times, enhance billing accuracy, or monitor clinical outcomes, focus on areas that will provide noticeable benefits for both your team and your patients. These steps are critical to unlocking the operational and financial advantages discussed earlier.
Choose the type of dashboard that aligns with your needs - be it operational, clinical, financial, or strategic. Set measurable KPIs to guide decision-making and map out the data sources you'll need, ensuring they are both accurate and complete. From the beginning, incorporate regulatory standards like HIPAA, HiTrust, and FHIR. Implement role-based access, audit trails, quality checks, and a solid data governance framework. Including key stakeholders in the design process is crucial to ensure the dashboard meets practical, day-to-day needs.
A modern data architecture is essential for unifying fragmented systems like EHRs, ERPs, billing platforms, and supply chain tools. Leveraging cloud-native solutions such as Databricks or Snowflake, hosted on platforms like Azure, AWS, or GCP, allows for automated data ingestion and transformation. These platforms also support advanced analytics, reporting, and even AI applications.
Using tools with pre-built connectors and APIs can significantly reduce errors and simplify workflows. As Paul Kovalenko explains:
"Integration is crucial when developing performance dashboards for healthcare. A well-designed dashboard should be able to integrate seamlessly with existing systems and technologies, such as electronic health records (EHRs), medical imaging systems, and laboratory information systems".
When integration is done right, centralized data can save clinicians up to 30% of their time. Strong data validation processes are also essential to ensure accuracy and build user trust. Once the technical foundation is in place, the focus should shift to ensuring the team adopts and effectively uses the tool.
Ben Sharpe, former CEO of RET Physical Therapy Group and founder of Practice Dashboard, highlights the importance of building a culture around dashboard use:
"Had we just rolled out the tool and not emphasized the culture, we wouldn't have succeeded. But we put our bonus system in place around the tool, we encouraged using it at staff meetings, I was always showing it off, and always talking about the metrics we were tracking".
Start small by introducing 2–3 key metrics and explaining why they matter to the team. Make sure dashboards are easy to access and use - whether on a smartphone or desktop - so that staff members don’t need technical expertise to engage with them. Provide thorough onboarding and ongoing support through training sessions, online resources, or scheduled check-ins to help staff configure KPIs, roles, and reports. Secure, role-based access ensures everyone sees the data most relevant to their role.
Incorporate dashboard usage into everyday operations, such as team meetings, performance reviews, and quarterly planning sessions. Tie dashboard engagement to incentive systems, and encourage leaders to consistently reference and discuss tracked metrics in meetings. This approach fosters a data-driven culture where dashboards become a natural part of daily workflows.
It’s worth noting that only 50% of dashboards involve end users in the design process, and just 22% undergo usability testing. Early and active involvement from your team can make all the difference. Additionally, education and feedback mechanisms are among the most effective strategies for increasing dashboard adoption, used in over half of implementations.
MedOps uses AI-driven automation to improve operational dashboards, making it easier to monitor and fine-tune workflows. By simplifying essential administrative tasks like insurance verification, it provides instant insights that integrate directly into your existing dashboard setup. This creates a solid base for tracking critical operational data with precision.
MedOps focuses on tracking key performance metrics, such as insurance verification success rates, task completion times, and error reduction. These metrics offer clear, actionable data to measure workflow efficiency and the impact of automation.
MedOps data integrates effortlessly through standard APIs and secure connectors, supporting protocols like FHIR and HL7. You can design custom views to monitor verification statuses in real time and set up alerts for verification failures. This level of transparency helps identify trends and adjust workflows to improve efficiency. Beyond just displaying data, MedOps delivers real operational and financial advantages.
Integrating MedOps into dashboards provides better visibility into both operations and finances. It enhances revenue forecasting, helps spot payment issues early, and minimizes manual tasks, allowing staff to focus on more valuable patient care. This unified approach supports smarter decisions related to staffing, scheduling, and resource allocation, all while maintaining excellent patient care standards.
Healthcare analytics dashboards are changing the way practice owners oversee their operations, finances, and patient care. By pulling together real-time data, these tools take the guesswork out of decision-making, helping to improve patient outcomes and drive financial growth.
To get started, focus on the metrics that matter most to your practice. Whether it’s cutting down on claim denials, improving patient scheduling, or monitoring revenue cycles, narrowing your focus to just 2–3 key metrics can make a big difference. Many practices see noticeable improvements within 30–90 days as automation takes over repetitive, manual tasks.
But having a great dashboard isn’t enough - it needs to work seamlessly with your existing systems. Look for platforms that integrate smoothly with your electronic health records (EHR) using standards like FHIR or HL7. For example, MedOps automates tasks like insurance verification and delivers actionable metrics directly to your dashboard. This creates a unified view of your operations and finances without disrupting your current workflows, making it easier to adopt a data-driven approach.
Creating a data-driven culture is equally important. Make sure dashboards are accessible to your team, explain the metrics being tracked, and use these insights in staff meetings and performance reviews. When everyone understands the numbers and can see how their work impacts the practice, accountability and engagement naturally improve.
The practices that see the most success with analytics dashboards are those committed to ongoing improvement. Regularly review your data, adjust workflows based on insights, and use benchmarks to uncover new opportunities. With the right dashboard strategy and tools like MedOps, you can spend less time buried in spreadsheets and more time focusing on exceptional patient care - all while strengthening your practice’s financial health.
Healthcare analytics dashboards play a pivotal role in improving patient care by providing real-time insights into key clinical metrics such as patient satisfaction, treatment effectiveness, and infection rates. These dashboards serve as visual tools that help healthcare providers pinpoint problem areas quickly, allowing them to take immediate action and enhance the quality of care.
By simplifying workflows and enabling data-informed decisions, these dashboards help healthcare teams allocate resources wisely, minimize errors, and prioritize patient outcomes. The result? A healthcare system that is safer, more efficient, and truly centered around the needs of patients.
To create an effective healthcare analytics dashboard, begin by assessing your current systems and data landscape. This step helps pinpoint any gaps and identify areas for improvement or opportunities to enhance functionality. Once that’s clear, outline a strategic vision that directly supports your practice’s goals - whether it’s enhancing patient care or streamlining financial operations.
Focus on building a flexible and future-ready architecture that integrates smoothly with your existing tools while adhering to healthcare regulations like HIPAA. It's also crucial to establish strong governance practices to ensure data remains accurate, private, and secure. When rolling out the dashboard, take a phased approach: start with essential metrics and gradually introduce additional features as users become more comfortable with the system.
MedOps transforms healthcare analytics by providing real-time, customizable dashboards that deliver insights into key metrics like financial performance, patient outcomes, and operational workflows. These dashboards integrate smoothly with existing electronic health record (EHR) systems, ensuring secure, HIPAA-compliant data visualization.
With MedOps, healthcare practice owners gain the tools to make smarter, data-driven decisions. The platform simplifies daily operations, allowing providers to focus on what matters most - enhancing patient care. Its intuitive features help monitor performance trends, pinpoint areas needing improvement, and allocate resources more efficiently, all tailored to the unique demands of U.S. healthcare practices.