Learn the key revenue cycle metrics, benchmarks and AI-driven strategies to reduce denials, speed collections, and improve cash flow for healthcare providers.
Managing your healthcare revenue cycle effectively is crucial for financial stability. Small errors can lead to delayed payments, lost income, and higher costs. With claim denial rates increasing by 17% on average in 2021, understanding and improving key metrics is essential.
Here’s what you need to know:
Tracking and improving these metrics with modern analytics and AI tools can significantly reduce revenue leaks and improve cash flow.
Healthcare Revenue Cycle Key Metrics Benchmarks and Targets
Tracking the right metrics can turn revenue cycle management into a strategic powerhouse. By focusing on specific performance indicators, healthcare organizations can identify where revenue leaks occur and address them promptly. These metrics fall into three main categories - patient access, claims and billing, and financial management - offering a complete picture of an organization's financial health.
Patient access metrics gauge how effectively front-end processes capture accurate information and secure payments before claims are submitted. For instance:
Another key metric is point-of-service (POS) cash collections, which measures patient payments collected before, during, or shortly after discharge. High-performing organizations collect over 50% of patient responsibility at the POS, accelerating cash flow and cutting follow-up billing costs. Meanwhile, the registration error rate highlights how often incorrect patient or insurance information leads to claim rejections, and the no-show or cancellation rate tracks missed appointments, which directly impact revenue. A no-show rate under 10% is considered a healthy benchmark.
For example, a behavioral health provider introduced an automation tool for eligibility verification, reducing eligibility-related denials to less than 1%.
Claims and billing metrics focus on how efficiently claims are submitted and accepted by payers.
Timeliness is another critical factor. Only 32% of healthcare providers capture charges within 24 hours of service. Charge lag, the time between delivering care and entering charges into the system, should ideally be under 48 hours for physician practices. For instance, one hospital network leveraged automation to slash their 90+ day accounts receivable from a high baseline to just 28 days.
These metrics play a vital role in ensuring claims are processed efficiently, directly impacting financial management outcomes.
Building on accurate claims and billing, financial management metrics focus on how quickly services are converted into collected revenue.
Other important metrics include the cost-to-collect ratio, which evaluates the expenses involved in collecting payments. Lowering this ratio boosts profitability. Lastly, the bad debt rate tracks the percentage of A/R written off as uncollectible. Industry standards recommend keeping this rate between 2% and 4% of net revenue.
These financial metrics ensure organizations maintain healthy cash flow and profitability while minimizing inefficiencies.
Knowing how to calculate revenue cycle metrics is just the starting point - making improvements is where the real impact happens. Each metric has its own formula and requires specific strategies to achieve better results.
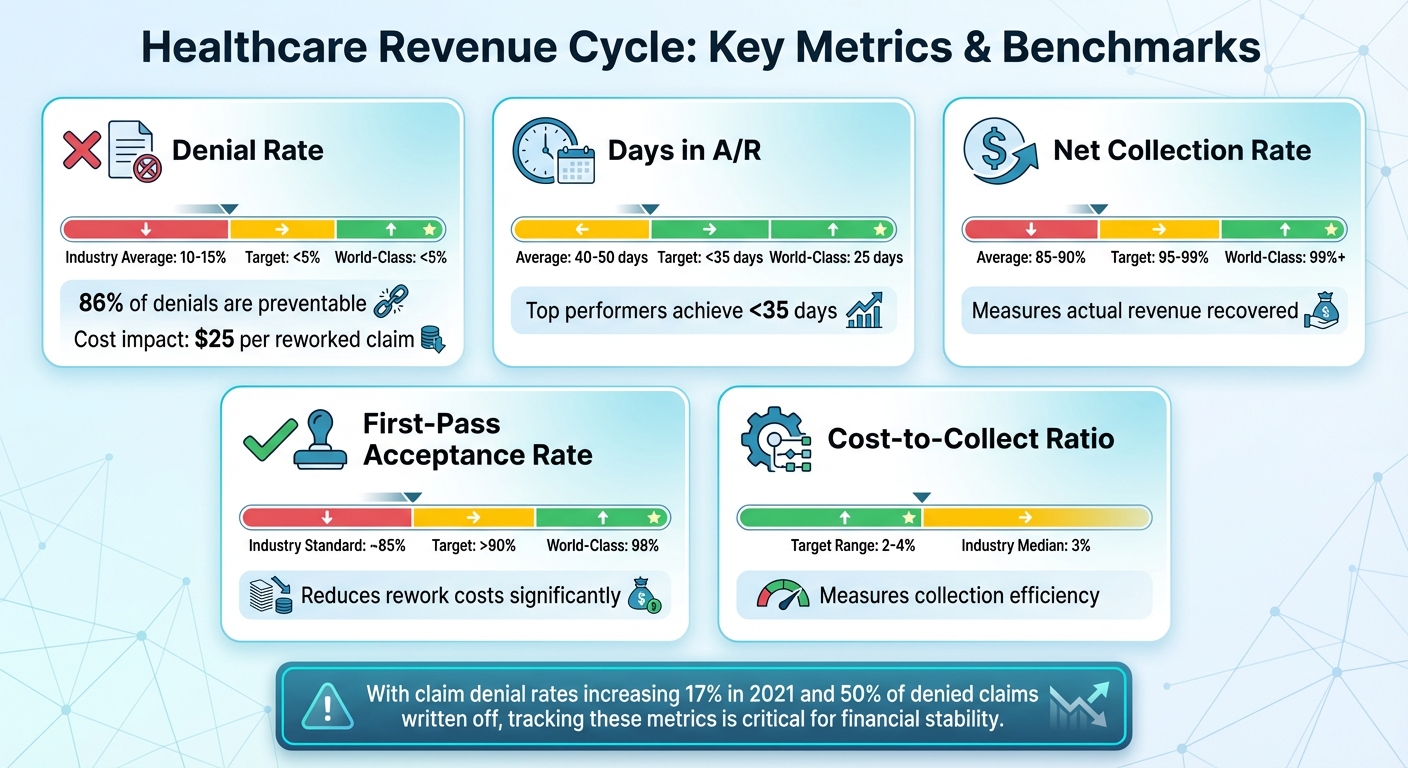
To calculate the denial rate, divide the total dollar amount of denied claims by the total dollar amount of claims submitted, then multiply by 100. For example, if $1,000,000 in claims were submitted and $70,000 were denied, the denial rate would be 7%. High-performing organizations aim for denial rates under 5%, while the industry average ranges between 5% and 10%.
Reducing denial rates starts with preventing errors before claims are submitted. Internal claims scrubbers are essential for catching issues early. According to Jim Denny, a high internal rejection rate often predicts fewer payer denials and better cash flow. Real-time eligibility checks at every patient visit can also help avoid denials related to ineligibility. Since reworking a denied claim costs about $25, focusing on prevention can save money immediately. Additionally, integrating workflows between electronic health record (EHR) and billing systems can minimize coding and submission errors.
From here, let’s look at Days in A/R, a metric that offers deeper insights into cash flow efficiency.
To calculate days in A/R, divide total accounts receivable (minus credits) by average daily revenue. Average daily revenue is determined by dividing total gross charges over a period by the number of days in that period. For instance, if total A/R is $500,000 and average daily revenue is $15,000, days in A/R would be 33 days.
Top-performing organizations keep days in A/R under 35 days. A range of 35–50 days is considered average, while anything above 50 days signals financial trouble. Some best-run practices achieve as low as 25 days. For example, one large behavioral health organization used automation to reduce its A/R days from over 90 to just 25.
To improve days in A/R, start by segmenting data by payer to identify which insurers are causing delays. Automating charge entry can reduce the lag between service delivery and claim filing to just 24–48 hours. It's also critical to monitor the percentage of A/R older than 120 days, aiming to keep this below 12%. Exclude accounts sent to collections from your analysis to uncover operational inefficiencies.
The net collection rate measures how much collectible revenue is actually received. Calculate it by dividing payments (minus credits) by charges (minus approved contractual adjustments). For example, if charges total $1,000,000, contractual adjustments are $200,000, and $780,000 is collected, the net collection rate would be 97.5%. Best-in-class organizations hit 99% or higher, while average rates fall between 95% and 99%. Anything below 95% is considered poor.
To improve this metric, reduce errors through workflow automation. Tools like self-service patient portals and automated billing reminders not only save staff time but also encourage faster patient payments. In fact, 60% of patients prefer receiving SMS billing notifications, and over half say such reminders would prompt quicker payments.
Next, let’s focus on the First-Pass Acceptance Rate, which directly impacts rework costs.
The first-pass acceptance rate (or first-pass resolution rate) tracks the percentage of claims accepted and paid on the first attempt. To calculate, divide the number of claims resolved on the first submission by the total number of resolved claims, then multiply by 100. The industry standard is 90% or higher, with top performers reaching as high as 98%.
Improving the first-pass rate starts with real-time validation tools and internal claims scrubbers, which catch errors before claims are submitted. Since reworking a denied claim can cost $25, maintaining a high first-pass rate reduces operational expenses. Practices should also aim for an automated payment posting rate above 80% to cut down on manual labor.
Finally, let’s examine the Cost-to-Collect Ratio, a key measure of collection efficiency.
The cost-to-collect ratio measures how efficiently revenue is collected. It’s calculated by dividing total revenue cycle costs by total cash collected. For example, if RCM costs are $100,000 and collections total $3,000,000, the cost-to-collect ratio is 3.33%. The target range is 2% to 4%, with 3% being the industry median.
To lower this ratio, streamline workflows through automation. Self-service payment portals can reduce the workload on front-desk staff, while automated follow-ups eliminate the need for manual calls and paper statements. Custom workflows can also help eliminate redundant tasks, allowing staff to focus on more complex cases. Additionally, training front-desk staff to use financial responsibility scripts for explaining deductibles and co-pays at the point of service can boost upfront collections and reduce downstream efforts.
| Metric | Formula | Target Benchmark |
|---|---|---|
| Denial Rate | (Total Denied Claims / Total Submitted Claims) × 100 | < 5% |
| Days in A/R | Total A/R / Average Daily Revenue | < 35 days |
| Net Collection Rate | Payments / (Charges – Contractual Adjustments) | 95–99% or higher |
| First-Pass Acceptance | (Claims Resolved on 1st Submission / Total Resolved) × 100 | > 90% |
| Cost-to-Collect | Total RCM Costs / Total Cash Collected | 2–4% |
Artificial Intelligence (AI) is transforming revenue cycle management (RCM), delivering over 20% improvements in key metrics like denial prevention and cash flow. Currently, about 46% of hospitals and health systems have integrated AI into their revenue cycle operations, and the global AI in RCM market is expected to hit $70 billion by 2030.
The financial toll of claim denials is staggering, with U.S. hospitals spending between $19 billion and $25 billion annually to address them. With average denial rates hovering around 10–15% - and top-performing organizations achieving rates below 5% - the potential savings from AI adoption are immense. Below, we explore how AI-driven claims processing, real-time validation, and workflow automation are reshaping revenue cycle performance.
AI uses Natural Language Processing (NLP) to convert clinical documentation into billing codes with remarkable accuracy, boosting coder productivity by as much as 40%. Robotic Process Automation (RPA) takes over repetitive tasks like data entry, claim scrubbing, and status checks, ensuring claims are complete and properly formatted before submission.
By validating data fields and catching errors early, AI helps maintain high first-pass rates, reducing costly rework. Integrating AI into billing workflows also proactively identifies code mismatches or documentation gaps, minimizing the chances of claim denials.
Predictive analytics analyze historical claim data to flag potential issues or high-risk services before claims are submitted. Real-time monitoring of payer policies further reduces rejections. At the point of service, real-time eligibility verification prevents errors like inactive policies or missing authorizations, which are common causes of denials.
Machine learning goes a step further by predicting claim outcomes and identifying accounts likely to face payment delays. Studies reveal that 60–80% of insurance denials can be successfully overturned on appeal. AI prioritizes denied claims with the highest likelihood of recovery, allowing staff to focus their efforts where it matters most. Additionally, algorithms compare payer contracts to actual payments in real time, uncovering systemic underpayments and recovering revenue that might otherwise slip through the cracks.
AI doesn’t just identify issues - it also streamlines operations with tailored workflow automation. Tools like Agentic AI can autonomously manage processes like insurance verification and billing inquiries, requiring minimal human involvement. Solutions like MedOps integrate seamlessly with existing systems, eliminating redundant tasks and freeing up staff to handle more complex cases. Automated payment posting rates exceeding 80% significantly reduce manual workloads, while AI-powered follow-up prioritizes outstanding claims based on recovery potential.
By automating repetitive tasks such as payment posting and secondary claim processing, AI lowers the cost-to-collect ratio. It also enables organizations to segment patient outreach, predict payment behaviors, and provide personalized payment plans or financial counseling to improve collection rates.
As the Healthcare Financial Management Association (HFMA) emphasizes, "Embracing AI and automation in RCM is no longer an option - it is a strategic imperative".
| Metric | Industry Average | World-Class Target | AI Impact |
|---|---|---|---|
| Denial Rate | 10–15% | <5% | Proactively flags high-risk claims |
| First-Pass Resolution | ~85% | 90–99% | Ensures claims are clean on first submission |
| Net Collection Rate | 85–90% | >95% | Identifies systemic underpayments |
| Days in A/R | 40–50 days | <35 days | Speeds up submission and follow-up |
Making daily improvements isn't just about keeping tabs on numbers; it’s about having real-time access to data, payer-specific insights, and forecasts that look ahead. With 90% of healthcare leaders saying operating costs are outpacing revenue, waiting for monthly reports that arrive too late to stop financial leaks is no longer an option. Daily monitoring flips the script by turning metrics into immediate actions, leaving outdated monthly reports in the dust. The backbone of this proactive approach? Real-time dashboards that bring key performance indicators (KPIs) into one clear view.
Dashboards that pull in real-time data and consolidate KPIs let managers catch issues as they arise. Instead of relying on manually created reports that lag behind, dashboards provide continuous updates, keeping operations ahead of the curve. Whenever possible, use the General Ledger (GL) as your main data source - it’s reliable, auditable, and easy to verify.
Breaking metrics down by payer, provider, or department can uncover hidden bottlenecks. For example, you can set up dashboards to monitor internal rejection rates from clearinghouses or scrubbing tools, catching errors before they even reach the payer. Considering that only 32% of healthcare providers manage to capture charges within the first 24 hours of service, dashboards can highlight recurring delays in documentation by specific providers or departments, guiding targeted retraining efforts.
When calculating accounts receivable (A/R), look at it both with and without accounts sent to collections. This gives a clearer picture of how your internal teams are performing. Treat patient payment plans as a separate "payer" category to avoid skewing A/R aging metrics. Real-time point-of-service (POS) collection data can also be a game-changer - use it to train front-desk staff on offering payment plans and verifying insurance eligibility before a visit even happens. Beyond dashboards, diving into payer-specific data can uncover even deeper financial insights.
Looking at overall metrics can sometimes hide problems tied to specific payers. For instance, while the total days in A/R might average 45, Medicaid claims could be sitting at 75 days, signaling a serious cash flow bottleneck. Breaking down Days in A/R by each payer helps pinpoint which insurance companies are causing delays.
Payer-specific data is also a powerful tool during contract renegotiations. By tracking metrics like net collection rates and denial rates by payer, you can identify insurers that are particularly costly to work with. Similarly, segmenting aged A/R by payer helps billing teams focus on the insurance groups with the most overdue claims - those past 90 or 120 days. Treating payment plans as their own "payer" category can further clarify how they’re impacting your overall A/R and cash flow, helping you decide whether patient financing arrangements are actually helping or hurting your collection goals.
Predictive analytics takes historical data and turns it into forecasts, helping organizations allocate resources wisely and manage cash flow more effectively. Healthcare providers using predictive models have seen a 20% drop in claim denials and a 15% boost in revenue capture.
One key application is prioritizing outstanding A/R. Instead of working through claims in order or at random, AI-powered tools rank claims by their likelihood of being collected. This ensures staff focus their efforts on the most recoverable dollars first. This approach is crucial, especially when about 50% of denied claims are written off without any attempt to fix or resubmit them.
Predictive modeling also helps identify patterns in claim denials, giving providers the chance to address recurring issues before they happen. By analyzing the root causes of denials, organizations can spot systemic problems in documentation or coding that lead to repeated rejections. Monitoring charge lag - the time between a service date and claim filing - can highlight departments or services that are prone to delays in payments. Using internal editing systems to catch errors before submission adds another layer of protection against payer denials.
Lastly, revenue and cash flow forecasting allows organizations to anticipate slow months and take action ahead of time. Whether it’s adjusting staffing, renegotiating payment terms with vendors, or securing short-term financing, these forecasts help facilities stay financially stable.
Revenue cycle management plays a critical role in ensuring financial stability for healthcare organizations. With more than 50% of denied claims being written off as lost revenue, there’s a clear opportunity to recover substantial income by adopting advanced analytics and automation.
Leading organizations set the bar high by leveraging data to achieve impressive financial outcomes. For instance, top performers maintain net collection rates above 99%, keep denial rates under 5%, and manage Days in A/R to less than 35 days. These results are not accidental - they stem from implementing AI-driven tools that detect errors before claims are submitted, focus on the accounts most likely to yield recoveries, and provide real-time insights into financial performance. Such strategies exemplify how a data-first approach can drive operational excellence.
AI-powered solutions, like MedOps, are reshaping revenue cycle management. Features such as real-time validation, automated claim scrubbing, and predictive modeling reduce manual work and improve accuracy. Organizations using these technologies have reported remarkable results, including increases in post-service patient payments by 75% to 300% and achieving patient satisfaction rates of 95%.
The message for healthcare leaders is clear: the time to act is now. Embracing analytics and automation is no longer optional - it’s essential to staying financially viable. Use real-time dashboards and predictive models to identify inefficiencies and uncover opportunities. Break down performance metrics by payer to address bottlenecks and optimize workflows. With proven tools and benchmarks readily available, the path to improved revenue cycle performance is within reach. Commit to leveraging these solutions to secure a stronger financial future.
AI plays a critical role in improving first-pass claim acceptance rates by cutting down on errors during crucial revenue cycle steps. With the help of predictive analytics, AI reviews claims before submission, identifying potential problems like missing codes, eligibility issues, or payer-specific requirements. This allows staff to address errors immediately, boosting acceptance rates significantly. On top of that, AI-driven eligibility verification reduces manual entry mistakes, avoiding common errors that often result in claim denials.
AI-powered tools, including natural language processing and machine learning, take coding accuracy to the next level. They analyze clinical documentation to assign the correct CPT and ICD-10 codes, while also suggesting the appropriate claim format and necessary attachments based on each insurer’s guidelines. This ensures claims are compliant from the start. Plus, AI continuously learns from past denials, refining its processes to prevent similar errors in the future. The result? Faster reimbursements and stronger financial outcomes for healthcare organizations.
Reducing denial rates to under 5% takes a mix of smart planning and ongoing oversight. One key step is integrating real-time insurance verification with your EHR system. This helps catch eligibility problems before patients receive services, cutting down on unnecessary denials.
Another critical piece? Staff training. Proper training ensures your team is equipped to handle accurate coding and verification, reducing mistakes that often lead to denials.
You can also use AI-powered analytics tools to monitor denial trends and flag potential problems early. Since avoidable denials make up a large portion of cases, focus on uncovering their root causes and fixing those issues. By regularly reviewing and fine-tuning these processes, you can keep denial rates low and boost the overall performance of your revenue cycle.
Real-time data has transformed the revenue cycle process, making it faster and more efficient. For example, instant insurance eligibility checks and live updates on claim statuses allow providers to verify coverage within seconds. This means potential issues like missing authorizations or incorrect coding can be addressed before services are rendered. The payoff? Fewer claim denials, quicker cash flow, and fewer billing surprises for patients.
With continuous updates, critical metrics - like days in accounts receivable, net collection rate, and denial rate - can be tracked almost immediately. This gives revenue cycle managers the ability to spot bottlenecks and take action quickly, such as initiating automated follow-ups for delayed claims. The end result is faster claim resolutions, stronger financial outcomes, and more time for staff to focus on improving the overall patient experience.