Use data, KPIs, AI, and automation to cut denials, speed collections, and improve cash flow in medical practices.
Want to improve your medical practice's financial health? Revenue cycle analytics is the answer. It’s about using data to monitor and optimize every stage of the revenue cycle - from patient registration to payment collection. Here’s why it matters:
By applying analytics, practices can reduce claim denials, speed up payments, and improve cash flow. Key metrics like Days in Accounts Receivable (DAR), Clean Claim Rate (CCR), and Net Collection Rate (NCR) help identify inefficiencies and track performance. Advanced tools like AI and automation further streamline operations, saving time and reducing costs.
The bottom line: Practices that invest in analytics see faster collections, fewer errors, and healthier finances. Ready to take control of your revenue cycle? Let’s dive into how it works.
Revenue Cycle Analytics Key Metrics and Benchmarks for Medical Practices
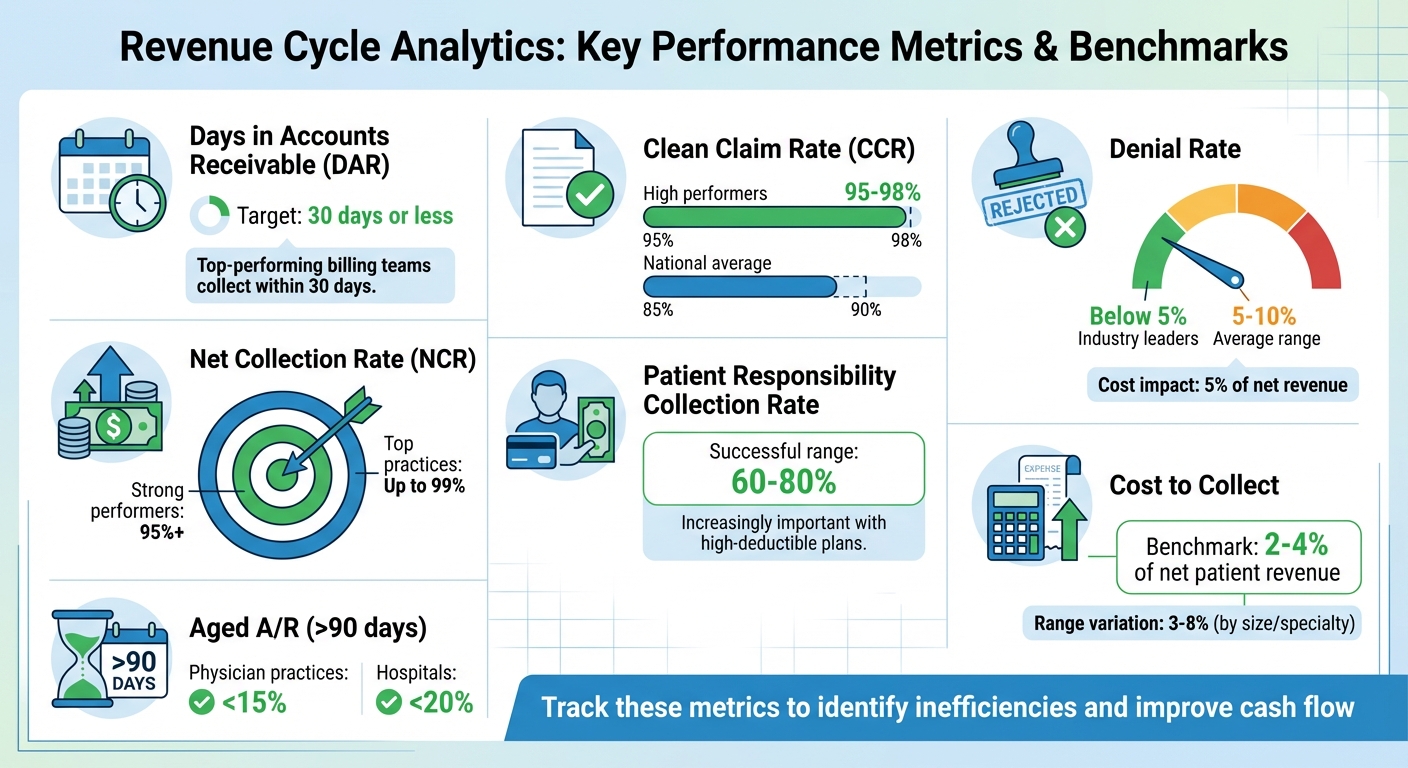
Tracking the right metrics is essential for managing revenue effectively. One of the most critical is Days in Accounts Receivable (DAR), which measures how long it takes to collect payments. Top-performing billing teams aim to collect within 30 days. A high DAR could mean your cash flow is tied up in uncollected payments, impacting your ability to fund operations.
Another key metric, Clean Claim Rate (CCR), reflects the percentage of claims submitted without errors. High-performing healthcare organizations achieve CCRs above 95%, with some even reaching 98% or more. In contrast, the national average is around 85-90%. Similarly, the First Pass Resolution Rate tracks claims paid on the first submission without needing follow-up. Errors in claims delay payments and drive up administrative costs.
The Denial Rate measures the percentage of rejected claims. Industry leaders keep this rate below 5%, while the average ranges from 5-10%. Denials are costly, often eating up 5% of a healthcare organization’s net revenue. For a broader view of revenue cycle health, Net Collection Rate (NCR) is invaluable. It measures how effectively collectable revenue is being collected. Strong performers exceed 95%, with some practices maintaining as high as 99%.
With the rise of high-deductible health plans, the Patient Responsibility Collection Rate has become increasingly important. Successful organizations typically collect 60-80% of patient-responsible balances. Another metric to watch is Cost to Collect, which calculates the expenses required to collect each dollar of revenue. Benchmarks range from 2-4% of net patient revenue, though this can vary between 3-8% depending on practice size and specialty. Lastly, Aged A/R as a Percentage of Total Billed A/R helps assess collectability. For accounts over 90 days old, the benchmark is less than 15% for physician practices and 20% for hospitals.
To effectively track these metrics, practices need data from multiple systems working together seamlessly.
Revenue cycle analytics relies on data from several interconnected systems. Electronic health records (EHRs) provide essential clinical documentation, including diagnosis codes and procedure details, which are key for accurate billing. Practice management systems handle scheduling, registration, charge capture, and payment posting, forming the backbone of the revenue cycle.
Clearinghouses act as intermediaries between practices and payers, offering real-time updates on claim status and rejection notifications. Payer remittances, such as Electronic Remittance Advice (ERA) and Explanation of Benefits (EOB), reveal payment details, adjustment codes, and reasons for claim denials. Meanwhile, patient payment portals track balances, payment plans, and collection activities, shedding light on the growing share of revenue coming directly from patients.
Integrating these data sources creates a comprehensive view of financial performance. Without integration, data silos can hinder analysis and delay critical insights.
Once data is consolidated, segmenting it can uncover specific performance gaps. For example, segmenting by payer allows you to compare expected versus actual payments, helping identify underpayments or discrepancies. It also highlights which payers contribute to higher Days in Accounts Receivable, enabling targeted interventions. Since commercial insurance and Medicare Fee-For-Service operate differently, each requires tailored strategies.
Segmenting by service type - such as CPT codes, denial reasons, or procedures - can pinpoint coding and billing issues. Reviewing rejection codes helps identify non-covered services and billing errors. If denials are due to missed or incorrect pre-authorizations, you can address these gaps by aligning billed and preauthorized CPT codes. Standardizing workflows for cases that often lead to bad debt can also reduce financial losses.
Another valuable approach is segmenting by patient demographics and financial responsibility. This helps evaluate a patient’s ability to pay and improve financial assistance programs. Providing detailed cost estimates and payment plans 2-3 weeks before procedures ensures patients understand their financial obligations. Strict upfront collection policies can reduce bad debt and improve cash flow. Breaking down data in this way turns broad reports into actionable steps that improve revenue cycle performance across the board.
The revenue cycle consists of several interconnected stages, and identifying issues early can significantly improve financial outcomes.
Front-end analytics focuses on improving patient scheduling and registration processes, which are the foundation of a smooth revenue cycle. Accurate patient registration and insurance verification are essential because errors at this stage often lead to claim denials and delayed payments. Analytics tools can pinpoint bottlenecks in patient access workflows, enabling targeted adjustments. Additionally, predictive analytics can anticipate potential payment delays and claim denials, allowing healthcare providers to address these issues proactively. These improvements at the front end establish a solid base for smoother operations in the mid-cycle phase.
With a strong front-end in place, the mid-cycle phase zeroes in on charge capture, medical coding, and claims submission. Analytics plays a crucial role here by monitoring key metrics to detect coding errors and submission delays. This minimizes mistakes and speeds up reimbursements. By identifying trends in coding errors, claim rejections, and denials, analytics helps uncover systemic issues. Addressing these root causes leads to more efficient billing practices and quicker payment cycles.
Back-end analytics shifts denial management and patient collections from reactive to proactive. It offers valuable insights into financial performance metrics, shedding light on patterns in claim denials, underpayments, and write-offs. This data helps organizations address the underlying causes of revenue loss, accelerating payment recovery and improving overall financial health. By leveraging these insights, healthcare providers can enhance their revenue recovery efforts and reduce financial leakage.
Artificial intelligence (AI) and automation are reshaping revenue cycle management (RCM) in the U.S. healthcare landscape. Nearly half of hospitals - about 46% - are now incorporating AI into their RCM processes, while 74% have adopted some level of revenue-cycle automation. These technologies are helping to handle repetitive tasks, allowing staff to focus on more complex cases.
AI shines in its ability to detect patterns in massive datasets that might elude human analysis. For example, machine learning can predict claim denials by analyzing past claims and payer behaviors. This predictive power enables healthcare practices to address potential issues before they become problems, rather than reacting to denials after they occur.
Natural language processing (NLP) plays a key role in interpreting clinical documentation and assigning accurate CPT and ICD codes. This technology adapts to the unique workflows of individual practices. In 2023, Auburn Community Hospital in New York demonstrated the power of combining RPA (robotic process automation), NLP, and machine learning. Their efforts led to a 50% reduction in discharged-not-final-billed cases, a 40%+ boost in coder productivity, and a 4.6% improvement in case mix index.
AI also strengthens denial management. By analyzing reasons for denials and cross-referencing them with payer rules, AI can automatically generate appeal letters. For instance, a community health network in Fresno implemented an AI tool that cut prior-authorization denials by 22% and service denials by 18%, saving 30–35 hours of staff time per week.
Automation has the potential to eliminate manual tasks throughout the revenue cycle. On the front end, tools like automated eligibility checks and self-service scheduling can significantly reduce administrative burdens. Experian Health’s platform, for example, has been shown to cut manual scheduling time by 50%, increase patient show rates to nearly 90%, and grow monthly patient volumes by up to 32% through self-service portals.
In the mid-cycle phase, automation helps with processes like claim scrubbing to catch errors before submission and automated charge capture to reduce coding mistakes. On the back end, automation streamlines payment posting, reconciliation, and variance resolution. These automated processes not only reduce human errors but also speed up reimbursement timelines. In fact, leveraging automation and analytics could potentially save the U.S. healthcare system $200 billion to $360 billion.
The results speak for themselves. Allegiance Mobile Health reported a 40% faster speed to collections, significantly shortening the time from billing to payment, by implementing AI-driven automation. Banner Health, which operates in states like California, Arizona, and Colorado, used an AI bot to automate insurance coverage discovery. This bot integrates patient coverage data across financial systems and generates appeal letters automatically based on specific denial codes.
MedOps takes automation and AI a step further by offering tailored solutions to optimize every phase of the revenue cycle. Its platform uses NLP to interpret clinical notes and apply accurate CPT and ICD codes, while learning from practice-specific data to adapt workflows.
In denial management, MedOps analyzes denial reasons, checks them against payer rules, and automatically generates appeal letters with all necessary documentation. Its 8-step automation pipeline handles everything from claim scrubbing and payment reconciliation to flagging underpayments, submitting appeals, estimating patient costs, and managing collections. Real-time dashboards provide full visibility into claims, payments, and denials, enabling quicker decision-making.
The impact has been tangible: MedOps clients have seen a 4.6% average monthly drop in denials for certain providers. With streamlined workflows and fast onboarding, many report measurable returns on investment in as little as 40 days.
To put revenue cycle analytics into action, start by assessing your current processes. Look for common pain points like frequent claim denials, extended accounts receivable (A/R) timelines, or incomplete collections. Setting clear, measurable goals can significantly increase the likelihood of improvement - by as much as threefold.
Effective data governance starts with assigning responsibilities. Clearly define who is accountable for managing data quality, conducting regular audits, and ensuring compliance with regulations like HIPAA, Medicare, and Medicaid.
Standardizing definitions is critical. For instance, everyone on the team should use the same criteria to classify denial reasons or calculate A/R days. Consolidate all financial data from systems like your practice management software, EHR, clearinghouses, and payer portals into one unified view. Without this consolidation, your analytics may produce inconsistent or unreliable insights.
Dashboards should be tailored to the unique needs of each team member.
Use U.S. formatting for dates (MM/DD/YYYY), currency ($), and percentages (%) to ensure clarity. Customizable reporting tools let users filter data by date range, payer, or provider, making the information relevant without overwhelming them. Real-time dashboards further enhance decision-making, allowing teams to respond quickly to emerging issues. Well-designed dashboards are essential for turning analytics into actionable insights and refining processes over time.
Analytics isn’t something you set up and forget - it’s an ongoing process. Review key performance metrics regularly, whether monthly or quarterly. If you notice a spike in denials from a particular payer, dig into the details. Is it a coding problem? A documentation issue? Or perhaps a recent change in the payer's rules?
Measure the outcomes of any changes you make. For example, if you revise your eligibility verification process, track whether this reduces front-end denials over the next 60-90 days. Cloud-based solutions can provide actionable insights within the same timeframe. Regular staff training is also vital to ensure everyone stays updated on best practices. By continuously monitoring and adapting, you can keep your analytics strategy aligned with your practice’s evolving needs.
Revenue cycle analytics is reshaping how U.S. medical practices handle their financial operations. Instead of reacting to problems after they arise, practices can now take a proactive approach - spotting inefficiencies early, reducing denial rates, and speeding up payment cycles. With effective analytics, denial rates can drop by as much as 40%, and accounts receivable (A/R) days can decrease by 15–20%.
Yet, there’s a gap between recognition and readiness. While 90% of healthcare financial executives see the value in analytics, only 40% report having mature capabilities. This gap represents a significant opportunity for practices ready to adopt data-driven strategies. Providers that integrate digital tools and analytics into their operations can see productivity gains of 15–20%.
The financial impact is striking. For example, a hospital with $3 billion in net revenue and a 10% denial rate could recover over $100 million in revenue that was previously at risk - just by leveraging effective analytics. Smaller practices, on the other hand, benefit from more straightforward wins: cleaner claims, quicker payments, and reduced administrative workloads, all of which contribute to stronger financial health.
These outcomes highlight the importance of robust data governance and ongoing process refinement, as previously discussed. Success in this area isn’t just about adopting new technology - it requires clear governance structures, customized dashboards, and consistent staff training. Regular reviews of key metrics and setting measurable goals are what turn analytics into a real competitive advantage. With nearly 46% of hospitals already using AI in their revenue cycle management (RCM) operations, the move toward data-driven solutions is gaining momentum.
For practices that embrace this shift, analytics becomes more than a tool - it’s an evolving process. By adapting to payer changes and refining strategies over time, organizations can continuously improve collections, streamline operations, and enhance overall financial performance.
Revenue cycle analytics leverages AI-powered insights to minimize claim denials by spotting potential issues before claims are submitted. These tools sift through data to uncover patterns and flag common problems, such as documentation mistakes, coding errors, or mismatches in insurance eligibility.
By addressing these problems upfront, healthcare practices can fix errors early, resulting in fewer denials and quicker claim approvals. This approach boosts first-pass payment rates, cuts down on administrative tasks, and helps prevent revenue loss, all while streamlining the billing process.
AI has become a game-changer in revenue cycle management by automating repetitive tasks, reducing errors, and even predicting claim denials before they happen. These capabilities help speed up reimbursements, improve cash flow, and boost operational efficiency - freeing up medical practices to dedicate more time to patient care.
With AI-powered tools, practices can streamline billing, verify insurance details with precision, and pinpoint bottlenecks in payment workflows. The result? Faster payments, lower administrative workloads, and significant cost savings, all contributing to stronger financial health for healthcare providers.
Bringing together data from different systems is key to gaining a clear and accurate understanding of your revenue cycle. This approach uncovers inefficiencies, like bottlenecks or revenue leaks, and enables smarter, real-time decision-making.
When medical practices consolidate their data into one actionable dashboard, they can simplify tasks such as billing, insurance verification, and payment tracking. This not only makes operations run smoother but also helps improve financial performance.